


Directorate of Environmental Services - Ministry of Forestry |
- Introduction IJ-REDD+ Project 2nd Phase
- Plan Vivo of TA8331-INO for Customary Forest (HutanAdat) Punan Adiu of District of Malinau approved
- Sustainable Forest and Biodiversity Management in the Heart of Borneo (HoB) of Kalimantan (TA 8331-INO Project) : “Land Cover Change Analysis and Carbon Emission Assessment For district of Malinau and Kapuas Hulu”
|
Posted: 17 May 2017 08:19 PM PDT
Proyek IJ-REDD+ merupakan proyek kerjasama antara Kementerian Lingkungan Hidup dan Kehutanan dengan JICA (Japan International Cooperation Agency), untuk mengembangkan mekanisme implementasi REDD+. Proyek yang dimulai pada Juni 2013 dalam perjalanannya diubah (supersede) periode pelaksanaannya; yang semula Juni 2016 hingga Juni 2016 (3 tahun) menjadi Juni 2016 - Juni 2018 (5 tahun). Penyesuaian periode tersebut sebagai tindak lanjut dari salah satu rekomendasi dalam "Joint Mid-Term Review Report" tertanggal 5 Maret 2015.
Penyesuaian periode Proyek IJ-REDD+, dalam pembahasannya juga diikuti dengan penyesuaian PDM (Project Design Matrix) sebagaimana lampiran Record of Discussion (ROD) tertanggal 13 Juni 2016, yaitu ditambahkannya Output 4: "Termobilisasinya kegiatan pengurangan emisi di Kalimantan Barat melalu ipengendalian kebakaran hutan dan lahan". Pada prinsipnya Output 4 tersebut menitikberatkan pada kegiatan mendukung penguatan kelembagaan serta upaya pengendalian kebakaran hutan dan lahan di tingkat kabupaten. Penyesuaian periode Proyek IJ-REDD+ pada prinsipnya hanya sedikit memperbaiki Output 1, Output 2, Output 3, serta Output 5, yaitu menjadi: Output 1) Dikembangkannya kerangka REDD+ di Provinsi Kalimantan Barat; Output 2) Dikembangkannya model REDD+ untuk TN. Gunung Palung serta lansekapnya; Output 3) Ditingkatkannya kapasitas monitoring karbon tingkat provinsi di Kalimantan Tengah; serta Output 5) Temuan proyek dirujuk dalam proses pengembangan implementasi mekanisme REDD+ tingkat nasional. Laporan singkat tentang proyek ini, dapat dibuka pada link ini. [teks | ©PJLHK |180517 |f ] | |||||||||||||||||||||||||||||||||||||||||||||||||||||||||||||||||||||||||||||||||||||||||||||||||||||||||||||||||||||||||||||||||||||||||||||||||||||||||||||||||||||||||||||||||||||||||||||||||||||||||||||||||||||||||||||||||||||||||||||||||||||||||||||||||||||||||||||||||||||||||||||||||||||||||||||||||||||||||||||||||||||||||||||||||||||||||||||||||||||||||||||||||||||||||||||||||||||||||||||||||||||||||||||||||||||||||||||||||||||||||||||||
|
Posted: 17 May 2017 07:56 PM PDT
Following the submission of draft PIN -Plan Vivo of customary forest of PunanAdiu(17,000 ha) of District of Malinau by the project on 3rd March 2017 to the Plan Vivo, on 2 May 2017 the Plan Vivo has approved the document with very minor requirement. Hence, the project now is able to proceed with developing PDD (Project Development Design) for the area, expected to be completed by July or August and submitted to the Plan Vivo for validation and verification.
To see the PINN, please open this link. [teks | ©PJLHK | 180517 |ts] | |||||||||||||||||||||||||||||||||||||||||||||||||||||||||||||||||||||||||||||||||||||||||||||||||||||||||||||||||||||||||||||||||||||||||||||||||||||||||||||||||||||||||||||||||||||||||||||||||||||||||||||||||||||||||||||||||||||||||||||||||||||||||||||||||||||||||||||||||||||||||||||||||||||||||||||||||||||||||||||||||||||||||||||||||||||||||||||||||||||||||||||||||||||||||||||||||||||||||||||||||||||||||||||||||||||||||||||||||||||||||||||||
|
Posted: 17 May 2017 01:55 AM PDT
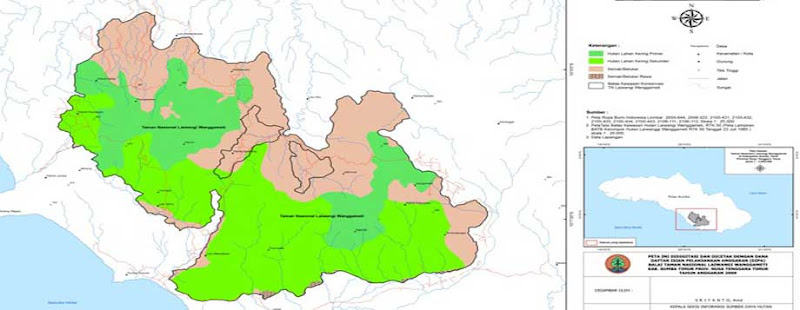
 Land cover changes analysis and carbon emission assessment is part of Plan Vivo requirement to provide deforestation and emission rate from the selected project area (customary forest of PunanAdiu in district of Malinau and village forest of Nanga Lauk in district of Kapuas Hulu). The works in particular at district level were done as continuation from the previous activities completed by GIZ FORCLIME Project No. 2007.2135.7. The time frame of this assessment is 2010 to 2016. Yet the analysis will be incorporated with the FORCLIME analysis which covered 2005 and 2010. Land cover changes analysis and carbon emission assessment is part of Plan Vivo requirement to provide deforestation and emission rate from the selected project area (customary forest of PunanAdiu in district of Malinau and village forest of Nanga Lauk in district of Kapuas Hulu). The works in particular at district level were done as continuation from the previous activities completed by GIZ FORCLIME Project No. 2007.2135.7. The time frame of this assessment is 2010 to 2016. Yet the analysis will be incorporated with the FORCLIME analysis which covered 2005 and 2010.The methods are mainly using Spatial Quantitative Analysis based on remote sensing and GIS analysis on the land cover change in the target areas. The following are summary methodology of the works.
Table 1. Spatial extent of change process of 2005-2016 in district of Malinau
Table 2. Spatial extent of carbon change per class 2005-2016 for district of Malinau
The deforestation and emission in customary forest of PunanAdiu was calculated by sub-setting the deforestation data of district of Malinau using similar procedure. The results are presented in Table 3 and 4. Table 3. Spatial extent of forest and non forest areas in customary forest of PunanAdiu (in ha)
Table 4.Spatial extent of carbon change of customary forest of PunanAdiu for 2005 -2016 (in ton)
Table 5. Spatial extent of change process of 2005-2016 in district of Kapuas Hulu
Table 6.Spatial extent of carbon change in from 2005, 2010 and 2016 in ha of district of Kapuas Hulu
Table 7. Spatial extent of forest and non-forest areas in village forest of Nanga Lauk (in ha)
Table 8. Spatial extent of carbon change per classes 2005-2016 for forest village of Nanga Lauk
[teks&foto | ©PJLHK | 170517 |ts] | |||||||||||||||||||||||||||||||||||||||||||||||||||||||||||||||||||||||||||||||||||||||||||||||||||||||||||||||||||||||||||||||||||||||||||||||||||||||||||||||||||||||||||||||||||||||||||||||||||||||||||||||||||||||||||||||||||||||||||||||||||||||||||||||||||||||||||||||||||||||||||||||||||||||||||||||||||||||||||||||||||||||||||||||||||||||||||||||||||||||||||||||||||||||||||||||||||||||||||||||||||||||||||||||||||||||||||||||||||||||||||||||
| You are subscribed to email updates from Direktorat PJLHK. To stop receiving these emails, you may unsubscribe now. | Email delivery powered by Google |
| Google Inc., 1600 Amphitheatre Parkway, Mountain View, CA 94043, United States | |


0 komentar:
Posting Komentar